


Application of Ultrasonic in Textile Wet Processing (Part-2)
2.1.2.6 Effect of Chemical Variation
Assuming that the ultrasound energy may reduce the consumption of chemicals and auxiliaries in the dyeing process of textile substrates, following experiment was carried out;
2.1.2.6.1 Methodology
2.1.2.6.1.1 Experiment Title:
Comparative study of Reactive Dyes Cl (Drimarene Cl) between CONTROL PROCESS (a), and EXPOSURE OF ULTRASOUND (b), by varying the quantities of different chemicals used on 100% Cotton special weave (22 x 22 / 60 x 60) by Exhaust Process.
2.1.2.6.1.2 CONTROL BATH (a)
Recipes Followed: Bath I
- Drimarene Cl (%) 1.0
- Drimagen E2R (g/l) 2.0
- Glauber’s salt (g/l) 60
- Soda Ash (%) 3.5
- Caustic Soda 36 oBe’ (ml/l) 0.5
- Temperature (oC) 60
- L:R 1:20
ULTRASONIC BATHS (b)
Bath I ….Bath II …..Bath III ….Bath IV
Bath I ….Bath II …..Bath III ….Bath IV
- Drimarene Cl (%) 1.0 1.0 1.0 1.0
- Drimagen E2R (g/l) 2.0 2.0 2.0 2.0
- Glauber’s salt (g/l) 30 45 60 60
- Soda Ash (%) 3.5 3.5 1.75 2.62
- Caustic Soda 36 oBe’ (ml/l) 0.5 0.5 0.5 0.5
- Temperature (oC) 60 60 60 60
- Ultrasound Energy (35 kHz) 60 60 60 60
- L:R 1:20 1:20 1:20 1:20
2.1.2.6.1.3 Procedure:
- Above mentioned control bath (a) was set in standard dye bath at 60 oC with salt and leveling agent, then stirred about 10 mins, while ultrasonic baths (b) were set in ultrasonic dye bath at 60 oC with required quantities of salt and leveling agent, then stirred about 10 mins.
- •Then 5 ml dye was poured in all beakers (a) and (b), after that 5 gm fabric was added in all of the beakers.
- Liquor in all the beakers (a) and (b) was continuously stirred at 60 oC for about 20 mins more under respective conditions.
- After that required quantities of alkali (Soda Ash & Caustic Soda) was added in all the beakers (a) and (b).
- Liquor in all the beakers (a) and (b) was continuously stirred at 60 oC for about 30 mins.
- At last the liquor of both the beakers was drained and the sample was washed with standard method.
2.1.2.6.1.4 Results
Following are the CIE color lab (CMC tests) conducted on data color;
Following are the CIE color lab (CMC tests) conducted on data color;
| Name of dye | % of Salt | Control | Ultrasound | ||||
| Reactive Cl Blue | 50 | 100 % | 94.39% | ||||
| Reactive Cl Blue | 75 | 100 % | 104.49% | ||||
| Name of dye | % of Alkali | Control | Ultrasound | ||||
| Reactive Cl Blue | 50 | 100 % | 114.50 % | ||||
| Reactive ClBlue | 75 | 100 % | 112.87 % | ||||
2.1.2.6.1.5 Conclusions:
It is concluded that,
It is concluded that,
- Even low dosing of salt in ultrasonic baths, the comparative percentage yield of ultrasonic samples approaches to the control samples.
- When low dosing of alkali in ultrasonic baths were checked, the comparative percentage yield of ultrasonic samples are still higher than the control samples.
- Experiments show that quantities of chemicals can be saved when ultrasonic aided dyeing is carried out.


2.1.2.7 Effect on Knitted Fabric
The basic purpose of this experiment was to check the effect of ultrasonic energy on knitted substrate;
2.1.2.7.1 Methodology
2.1.2.7.1.1 Experiment Title:
Comparative study of Reactive Dyes Cl (Drimarene Cl) between CONTROL PROCESS (a), and EXPOSURE OF ULTRASOUND (b), on 100% Knitted fabric by Exhaust Process.
2.1.2.7.1.2 Recipes Followed: ..(a).. (b)
- Drimarene Cl (%) 1.0 1.0
- Drimagen E2R (g/l) 2.0 2.0
- Glauber’s salt (g/l) 60 60
- Soda Ash (%) 3.5 3.5
- Caustic Soda 36 oBe’ (ml/l) 0.5 0.5
- Ultrasound Energy (35 kHz) - 60 min
- Temperature (oC) 60 60
- L:R 1:20 1:20
2.1.2.7.1.3 Procedure:
- Beaker (a) was set in the standard dye bath at 60 oC with salt and leveling agent, then stirred about 10 mins, while beaker (b) was set in ultrasonic dye bath at 60 oC with salt and leveling agent, then stirred about 10 mins.
- Then 5 ml dye was poured in both the beakers (a & b), after that 5 gm fabric was added to both the beakers.
- Liquor in all the beakers (a) and (b) was continuously stirred at 60 oC for about 20 mins more under respective conditions.
- After that required quantities of alkali (Soda Ash & Caustic Soda) was added in the beakers (a & b).
- Dyeing was continued with constant stirring and sample was drawn after 30 min from all the baths.
- At last the liquor of all the beakers was drained and the samples were washed with standard method.
2.1.2.7.1.4 Results
Following are the CIE color lab (CMC tests) conducted on data color;
Following are the CIE color lab (CMC tests) conducted on data color;
| Name of dye | Control | Ultrasound |
| Reactive Cl Blue | 100 % | 100.39% |
2.1.2.7.1.5 Conclusions:
It is concluded that,
It is concluded that,
- Results didn’t show any positive signs, the comparative percentage dye uptake is somewhat same.


2.1.3 Reactive HF Type dyes
Reactive HF type dyes which are relatively moderate reactive dyes were compared with and without ultrasound experiments, varying time, shade and chemicals consumption.
2.1.3.1 Effect of Dyeing Time Variation
The purpose of this experiment was to check the effect of ultrasonic waves on reducing the time required for the dyeing of textile substrate with reactive HF dyes;
2.1.3.1.1 Methodology
2.1.3.1.1.1 Experiment Title:
Comparative study of Reactive Dyes HF (Drimarene HF) between CONTROL PROCESS (a), and EXPOSURE OF ULTRASOUND (b) by varying the fixation time, on 100% Cotton special weave (22 x 22 / 60 x 60) by Exhaust Process.
2.1.3.1.1.2 Recipes Followed: …(a) …(b)
- Drimarene HF Blue (%) 1.0 1.0
- Drimagen E2R (g/l) 2.0 2.0
- Glauber’s salt (g/l) 60 60
- Soda Ash (g/l) 7.0 7.0
- Ultrasound Energy ~ 35 kHz - 50 – 60 – 70 - 80 min
- Temperature (oC) 60 60
- L:R 1:20 1:20
2.1.3.1.1.3 Procedure:
- Beaker (a) was set in the standard dye bath at 60 oC with salt and leveling agent, then stirred about 10 mins, while beaker (b) was set in ultrasonic dye bath at 60 oC with salt and leveling agent, then stirred about 10 mins.
- Then 5 ml dye was poured in beakers (a) and (b), after that 5 gm fabric was added to both of the beakers.
- Liquor in all the beakers (a) and (b) was continuously stirred at 60 oC for about 30 mins more under respective conditions.
- After that required quantities of alkali (Soda Ash) was added in the beakers (a) and (b).
- After adding alkali to the baths, samples were drawn out after 10, 20 and 30 min from the baths (a) and (b).
- Then last sample was drawn at 40 min from both of the baths.
- • At last the liquor of both the beakers was drained and the sample was washed with standard method.
2.1.3.1.1.4 Results
Following are the CIE color lab (CMC tests) results conducted on data color;
Following are the CIE color lab (CMC tests) results conducted on data color;
| Name of dye | Process | Control | Ultrasound |
| Drimarene HF Blue | Exhaustion 40 min & Fixation 10 min | 100 % | 123.63 % |
| Drimarene HF Blue | Exhaustion 40 min & Fixation 20 min | 100 % | 99.81 % |
| Drimarene HF Blue | Exhaustion 40 min & Fixation 30 min | 100 % | 100.16 % |
| Drimarene HF Blue | Exhaustion 40 min & Fixation 40 min | 100 % | 103.19 % |
2.1.3.1.1.5 Conclusions
It is concluded that;
It is concluded that;
- As exhaustion time kept constant and fixation time was varied, lower fixation time yield is better, while higher fixation time didn’t show any positive sign.


2.1.3.1.2 Methodology
2.1.3.1.2.1 Experiment Title:
Comparative study of Reactive Dyes HF (Drimarene HF) between CONTROL PROCESS (a), and EXPOSURE OF ULTRASOUND (b) by varying the fixation time, on 100% Cotton special weave (22 x 22 / 60 x 60) by Exhaust Process.
2.1.3.1.2.2 Recipes Followed: …(a) ….(b)
2.1.3.1.2.1 Experiment Title:
Comparative study of Reactive Dyes HF (Drimarene HF) between CONTROL PROCESS (a), and EXPOSURE OF ULTRASOUND (b) by varying the fixation time, on 100% Cotton special weave (22 x 22 / 60 x 60) by Exhaust Process.
2.1.3.1.2.2 Recipes Followed: …(a) ….(b)
- Drimarene HF Blue (%) 1.0 1.0
- Drimagen E2R (g/l) 2.0 2.0
- Glauber’s salt (g/l) 60 60
- Soda Ash (g/l) 7.0 7.0
- Ultrasound Energy ~ 35 kHz - 40 – 50 – 60 - 70 min
- Temperature (oC) 60 60
- L:R 1:20 1:20
2.1.3.1.2.3 Procedure:
- Beaker (a) was set in the standard dye bath at 60 oC with salt and leveling agent, then stirred about 10 mins, while beaker (b) was set in ultrasonic dye bath at 60 oC with salt and leveling agent, then stirred about 10 mins.
- Then 5 ml dye was poured in beakers (a) and (b), after that 5 gm fabric was added to both of the beakers.
- Liquor in all the beakers (a) and (b) was continuously stirred at 60 oC for about 20 mins more under respective conditions.
- After that required quantities of alkali (Soda Ash) was added in the beakers (a) and (b).
- After adding alkali to the baths, samples were drawn out after 10, 20 and 30 min from the baths (a) and (b).
- Then last sample was drawn at 40 min from both of the baths.
- At last the liquor of both the beakers was drained and the sample was washed with standard method.
2.1.3.1.2.4 Results
Following are the CIE color lab (CMC tests) results conducted on data color;
Following are the CIE color lab (CMC tests) results conducted on data color;
| Name of dye | Process | Control | Ultrasound |
| Drimarene HF Blue | Exhaustion 30 min & Fixation 10 min | 100 % | 153.33 % |
| Drimarene HF Blue | Exhaustion 30 min & Fixation 20 min | 100 % | 136.25 % |
| Drimarene HF Blue | Exhaustion 30 min & Fixation 30 min | 100 % | 123.92 % |
| Drimarene HF Blue | Exhaustion 30 min & Fixation 40 min | 100 % | 112.10 % |
2.1.3.1.2.5 Conclusions
It is concluded that;
It is concluded that;
- As the exhaustion time was kept less than the normal and fixation time was varied, same trend was observed that lower fixation time gives higher yield but in this case last result of ultrasonic sample is still significantly better than control samples
- On this basis dyeing time can be saved when ultrasonic aided dyeing is carried out on Reactive HF dyes.


2.1.3.2 Effect of Dye Concentration Variation
The purpose of this experiment was to check the effect of ultrasonic waves on reducing the consumption of dyestuff used for the dyeing of textile substrate with reactive HF dyes;
2.1.3.2.1 Methodology
2.1.3.2.1.1 Experiment Title:
Comparative study of Reactive Dyes HF (Drimarene HF) between CONTROL PROCESS (a), and EXPOSURE OF ULTRASOUND (b) by varying the dye concentration, on 100% Cotton special weave (22 x 22 / 60 x 60) by Exhaust Process.
2.1.3.2.1.2 Recipes Followed: …(a) ….(b)
- Drimarene HF Blue (%) 0.5 0.5
- Drimagen E2R (g/l) 2.0 2.0
- Glauber’s salt (g/l) 60 60
- Soda Ash (g/l) 7.0 7.0
- Ultrasound Energy ~ 35 kHz - 80 min
- Temperature (oC) 60 60
- L:R 1:20 1:20
2.1.3.2.1.3 Procedure:
- Beaker (a) was set in the standard dye bath at 60 oC with salt and leveling agent, then stirred about 10 mins, while beaker (b) was set in ultrasonic dye bath at 60 oC with salt and leveling agent, then stirred about 10 mins.
- Then 2.5 ml dye was poured in beakers (a) and (b), after that 5 gm fabric was added to both of the beakers.
- Liquor in all the beakers (a) and (b) was continuously stirred at 60 oC for about 30 mins more under respective conditions.
- After that required quantities of alkali (Soda Ash) was added in the beakers (a) and (b).
- Dyeing was continued with constant stirring and sample was drawn at 40 min from both the baths.
- At last the liquor of both the beakers was drained and the sample was washed with standard method.
2.1.3.2.1.4 Results
Following are the CIE color lab (CMC tests) results conducted on data color;
Following are the CIE color lab (CMC tests) results conducted on data color;
| Name of dye | Process | Control | Ultrasound |
| Drimarene HF Blue | Shade depth 0.5 % | 100 % | 108.87 % |
| Drimarene HF Blue | Shade depth 1.0 % | 100 % | 112.10% |
2.1.3.2.1.5 Conclusions
- When low dye concentration of ultrasonic and control samples were compared, the percentage dye uptake of ultrasonic sample was significantly higher.


2.1.3.3 Effect of Dyeing Temperature Variation
Keeping in a view that ultrasound reduces the consumption of energy; following experiment was carried out;
2.1.3.3.1 Methodology
2.1.3.3.1.1 Experiment Title:
Comparative study of Reactive Dyes HF (Drimarene HF) between CONTROL PROCESS (a) and EXPOSURE OF ULTRASOUND (b), by varying the temperature on 100% Cotton special weave (22 x 22 / 60 x 60) by Exhaust Process.
2.1.3.3.1.2 Recipes Followed: …(a) ……(b)
- Drimarene HF Red (%) 1.0 1.0
- Drimagen E2R (g/l) 2.0 2.0
- Glauber’s salt (g/l) 60 60
- Soda Ash (%) 7.0 7.0
- Ultrasound Energy ~ 35 kHz - 80 min
- Temperature (oC) 60 40
- L:R 1:20 1:20
2.1.3.3.1.3 Procedure:
- Beaker (a) was set in the standard dye bath at 60 oC with salt and leveling agent, then stirred about 10 mins, while beaker (b) was set in ultrasonic dye bath at 40 oC with salt and leveling agent, then stirred about 10 mins.
- Then 5 ml dye was poured in beakers (a) and (b), after that 5 gm fabric was added to both of the beakers.
- Liquor in beakers (a) was continuously stirred at 60 oC for about 30 mins while beaker (b) was stirred for 30 mins at 40 0C.
- After that required quantities of alkali (Soda Ash) was added in the beakers (a) and (b).
- Dyeing was continued for 40 mins at respective temperature.
- At last the liquor of both the beakers was drained and the sample was washed with standard method.
2.1.3.3.1.4 Results
Following are the CIE color lab (CMC tests) results conducted on data color;
Following are the CIE color lab (CMC tests) results conducted on data color;
| Name of dye | Control | Ultrasound |
| Reactive HF Blue | 100 % | 94.00% |
2.1.3.3.1.5 Conclusions
- When ultrasonic sample was dyed lower than the control sample, the result didn’t show any positive sign.


2.2 VAT DYES
Vat dyes are very important class of dyes for cellulosic fibers because the dyeing produced with these have the highest overall fastness properties. All of these dyes have good fastness against wet treatments and crocking and most have light fastness. Ultrasound energy enhances the vatting rate by disintegrating the dispersed water-insoluble dyestuff aggregates into smaller particles. Owing to the increase of the dyestuff surface, in addition to the simultaneous shortening of the diffusion path, the probability for collisions between molecules of the reducing agent and the dye molecules increases and finally the reaction rate will be faster.
Application of vat dyes of cellulosics material is occurred in five steps.
- Aqueous dispersion
- Vatting
- Absorption of dye molecule by the fiber
- Re oxidation of dye molecule within the fiber
- Soaping off
2.2.1 Classification:
Ciba vat dyes are classified as:
Ciba vat dyes are classified as:
- CIBANON CI TYPE
- CIBANON CII TYPE
2.2.2 Application method:
- LONG LIQUOR METHOD:
- STOCK VAT METHOD:
2.2.2.1 Long Liquor Method
In this method reduction of vat dyes is carried out during process in a single dye bath.
2.2.2.1.1 Methodology
2.2.2.1.1.1 Experiment Title:
Comparative study of Vat dyes (Cibanon Blue CI) between NORMAL PROCESS (CONTROL) (a), and EXPOSURE OF ULTRASOUND (b), on 100% Cotton special weave (22 x 22 / 60 x 60) by Exhaust Process.
2.2.2.1.1.2 Recipes Followed:….. (a)………. (b)
- Cibanon Blue (%) 4.0 4.0
- Irgasol Vat 10 % (g/l) 2.0 2.0
- Invadine 10 % (g/l) 2.0 2.0
- Ultrasound Energy (35 kHz) - 90 min
- Temperature (oC) 60 60
- L:R 1:20 1:20
2.2.2.1.1.3 Procedure:
- Control (a) and Ultrasound (b) dye baths were set at 30 oC with the above mentioned chemicals.
- After 10 mins, following chemicals were added in both control (a) and ultrasound (b) baths;
Caustic Soda 36 oBe (ml/l) 18 18
Sodium Hydrosulphite (g/l) 4.0 4.0
After addition of all the chemicals the temperature of both the baths temperature were raised to 60 oC in 30 mins with continuous stirring.
- Then dyeing was continued for 45 mins at 60 oC.
- Then liquor of both the baths was drained, samples were rinsed with cold water and oxidized with following chemicals;
Temperature (oC) 50 50
Time (min) 10 10
2.2.2.1.1.4 Results:
Following are the CIE color lab (CMC tests) conducted on data color;
| Name of dye | Process | Control | Ultrasound |
| Cibanon Blue | Long Liquor (CI) | 100 % | 138.26 % |
2.2.2.1.1.5 Conclusions
- The reducing ability of ultrasonic energy increases the dye uptake as compared with the conventional process. Long liquor method gives more yield due to long exposure of ultrasonic energy on the dyestuff as compared with the stock vat method.
- Hence ultrasonic aided dyeing of vat dyes gives higher yield keeping all attributes constant.


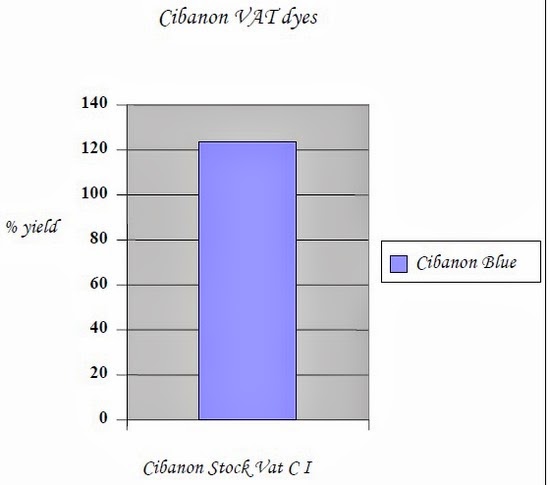
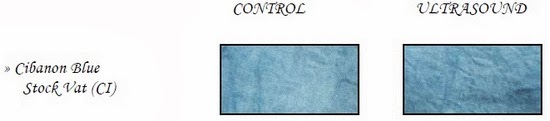
2.2.2.2 Stock Vat Method
In this method reduction of vat dyes is carried out in separate dye bath.
2.2.2.2.1 Methodology
2.2.2.2.1.1 Experiment Title:
Comparative study of Vat dyes (Cibanon Blue CI) between NORMAL PROCESS (CONTROL) (a), and EXPOSURE OF ULTRASOUND (b), on 100% Cotton special weave (22 x 22 / 60 x 60) by Exhaust Process.
2.2.2.2.1.2 Recipes Followed:……. (a) …..(b)
- Cibanon Blue (%) 4.0 4.0
- Irgasol Vat 10 % (g/l) 2.0 2.0
- Invadine 10 % (g/l) 2.0 2.0
- Ultrasound Energy (35 kHz) - 90 min
- Temperature (oC) 60 60
- L:R 1:20 1:20
- Caustic Soda (ml/l) (80% of total amount) 18.0 18.0
- Sodium Hydrosulphite (g/l) (80% of total amount) 4.0 4.0
- Albatex (g/l) 2.0 2.0
2.2.2.2.1.3 Procedure:
- • Control (a) and Ultrasound (b) dye baths were set at 30 oC with the above mentioned chemicals.
- • After 10 mins, following chemicals were added in both control (a) and ultrasound (b) baths, which were prepared in separate dyebath at room temperature.
Sodium Hydrosulphite (g/l) (20% of total amount) 4.0 4.0
After addition of all the chemicals the temperature of both the baths temperature were raised to 60 oC in 30 mins with continuous stirring.
- • Then dyeing was continued for 45 mins at 60 oC.
- • Then liquor of both the baths was drained, samples were rinsed with cold water and oxidized with following chemicals;
Temperature (oC) 50 50
Time (min) 10 10
2. 2.2.2.1.4 Results:
Following are the CIE color lab (CMC tests) conducted on data color;
| Name of dye | Process | Control | Ultrasound |
| Cibanon Blue | Stock Vat (CI) | 100 % | 123.32 % |
2.2.2.2.1.5 Conclusions
- • The reducing ability of ultrasonic energy increases the dye uptake as compared with the conventional process.
- • Hence ultrasonic aided dyeing of vat dyes gives higher yield keeping all attributes constant.
2. 2.2.3 Effect of Ultrasound on Reduction of Vat dyes
Ultrasound reduces the average size of the dye particles of vat dyes, when vat dye samples were treated with ultrasound the large particles were completely eliminated. Without ultrasound vat dyes may contain particles larger than 14 microns, but when vat dyes are treated with ultrasound the largest dye particles are smaller than 2 microns. So an experiment was conducted in which reduction of vat dyes were checked without the addition of reducing agent.
2.2.2.3.1 Methodology
2.2.2.3.1.1 Experiment Title:
Comparative study of Vat dyes (Cibanon Blue CI) in EXPOSURE OF ULTRASOUND, between reduction of vat dyes with Sodium hudrosulphite (a) and without Sodium Hydrosulphite (b), on 100% Cotton special weave (22 x 22 / 60 x 60) by Long Liquor method.
2.2.2.3.1.2 Recipes Followed: ….(a)….. (b)
- Cibanon Blue (%) 4.0 4.0
- Irgasol Vat 10 % (g/l) 2.0 2.0
- Invadine 10 % (g/l) 2.0 2.0
- Ultrasound Energy (35 kHz) - 90 min
- Temperature (oC) 60 60
- L:R 1:20 1:20
2.2.2.3.1.3 Procedure:
- • Dye baths (a & b) were set at 30 oC with the above mentioned chemicals in an ultrasonic bath.
- • After 10 mins, following chemicals were added in both (a) and (b) baths;
(a)…. (b)
Albatex (g/l) 2.0 2.0
Caustic Soda 36 oBe (ml/l) 18 18
Sodium Hydrosulphite (g/l) 4.0 -
After addition of all the chemicals the temperature of both the baths temperature were raised to 60 oC in 30 mins with continuous stirring.
Albatex (g/l) 2.0 2.0
Caustic Soda 36 oBe (ml/l) 18 18
Sodium Hydrosulphite (g/l) 4.0 -
After addition of all the chemicals the temperature of both the baths temperature were raised to 60 oC in 30 mins with continuous stirring.
- • Then dyeing was continued for 45 mins at 60 oC.
- • Then liquor of both the baths was drained, samples were rinsed with cold water and oxidized with following chemicals;
Temperature (oC) 50
Time (min) 10
2.2.2.3.1.4 Results:
Following are the CIE color lab (CMC tests) conducted on data color;
| Name of dye | Process | Ultrasound exposure without Na2S2O4 | Ultrasound exposure with Na2S2O4 |
| Cibanon Blue | Long Liquor (CI) | 100 % | 137.16 % |
2.2.2.3.1.5 Conclusions
- The comparative percentage yield of Ultrasonic exposure with hydro is substantially deeper than the Ultrasonic exposure without hydro.
- It is clear from the results that Ultrasonic energy also escalates the reduction of Vat dyes.


2.3 SULPHUR DYES
Among the dye-classes applicable to the cellulosic fibers, sulphur dyes are relatively less expensive and are quite easy to apply but produce dull shades as compared with the reactive, the vat and even the direct classes of dyes. These are available in a fairly large range of shade.
2.3.1 Methodology
2.3.1.1 Experiment Title:
Comparative study of Sulphur dyes (Sulphur black) between CONTROL PROCESS (a), and EXPOSURE OF ULTRASOUND (b), on 100% Cotton special weave (22 x 22 / 60 x 60) by Exhaust Process.
CONTROL BATHS (a)
2.3.1.2 Recipes Followed: Bath I ….Bath II
- Sulphur black (%) 8.0 4.0
- Sodium Sulphide (%) 16 8.0
- Soda ash (g/l) 2.0 1.0
- Glauber’s salt (g/l) 10 5.0
- Temperature (oC) 80 80
- L:R 1:20 1:20
ULTRASOUND BATHS (b)
Bath I ….Bath II
Bath I ….Bath II
- Sulphur black (%) 8.0 4.0
- Sodium Sulphide (%) 16 8.0
- Soda ash (g/l) 2.0 1.0
- Glauber’s salt (g/l) 10 5.0
- Ultrasound Energy (35 kHz) 80 min 80 min
- Temperature (oC) 80 80
- L:R 1:20 1:20
2.3.1.3 Procedure:
- Control (a) and Ultrasound (b) dye baths were set at 50 oC with the above mentioned chemicals.
- After 10 mins, previously dissolved dyestuff was poured into each respective baths.
- Then temperature of the both the dye baths were raised to 80 oC in 20 mins.
- •After that required amount of salt was added in all baths, then dyeing was continued for 60 mins at 80 oC.
- After completion dye baths was cooled and the liquor was drained.
- Then the fabrics were cold washed and oxidized with following chemical;
Temperature (oC) 50
Time (min) 10
2.3.1.4 Results:
Following are the CIE color lab (CMC tests) conducted on data color;
| Name of dye | Shade % | Control | Ultrasound |
| Sulphur black | 8.0 | 100 % | 142.05 % |
| Sulphur black | 4.0 | 100 % | 125.63 % |
2.3.1.5 Conclusions
- Results show that Sulphur dyeing when carried out with an exposure of ultrasonic waves, the comparative percentage dye uptake has drastically increased which ultimately saves energy, cost and chemical consumptions.


2.4 ACID DYES
The acid dyestuffs are so called because, in the first place, the original members of the class were applied in a bath containing mineral or organic acid, and secondly because they were nearly all sodium salts of organic acids and the anion is the active colored component, most of the acid dyes are sulphonic acid salts, but there are a few containing carboxyl groups.
2.4.1 Effect of Ultrasound on Wool Dyeing
The purpose of this experiment was to check the effect of ultrasonic waves on woolen substrate, following experiment was carried out;
2.4.1.1 Methodology
2.4.1.1.1 Experiment Title:
Comparative study of Acid dyes between CONTROL PROCESS (a), and EXPOSURE OF ULTRASOUND (b), on 100% Woolen yarns by Exhaust Process.
2.4.1.1.2 Recipes Followed: ….(a)……. (b)
- Lanasan Blue CF-B (%) 1.0 1.0
- Sandogen NH (%) 1.0 1.0
- Sodium Acetate (g/l) 2.0 2.0
- Acetic Acid (pH) 5.0 5.0
- Temperature (oC) 80 80
- Ultrasound Energy ~ 35 kHz - 60 min
- L:R 1:20 1:20
2.4.1.1.3 Procedure:
- Beaker (a) was set in the standard dye bath at 50 oC with Sandogen NH and Sodium Acetate, while beaker (b) was set in ultrasonic dye bath at 50 oC with Sandogen NH and Sodium Acetate then pH of the baths were adjusted and stirred for 10 mins.
- Then 5 ml dye was poured in beakers (a) and (b), after that 5 gm woolen yarn was added to both of the beakers.
- Temperature of the dye bath was raised to 80 oC and dyeing was carried out for 60 mins with continuous stirring.
- At last the liquor of both the beakers was drained and the sample was washed with standard method.
2.4.1.1.4 Results:
Following are the CIE color lab (CMC tests) conducted on data color;
Following are the CIE color lab (CMC tests) conducted on data color;
| Name of dye | Control | Ultrasound |
| Lanasan Blue CF-B | 100 % | 107.51 % |
2.4.1.1.5 Conclusions:
- Woolen yarns when dyed with ultrasound energy gives high yield but the percentage yield in however is not much significant.


2.4.2 Effect of Ultrasound on Silk Dyeing
The purpose of this experiment was to check the effect of ultrasonic waves on silk substrate, following experiment was carried out;
2.4.2.1 Methodology
2.4.2.1.1 Experiment Title:
Comparative study of Acid dyes between CONTROL PROCESS (a), and EXPOSURE OF ULTRASOUND (b), on 100% Silk fabric by Exhaust Process.
2.4.2.1.2 Recipes Followed: ….(a) ….(b)
- Lanasan Blue CF-B (%) 1.0 1.0
- Sandogen NH (%) 1.0 1.0
- Sodium Acetate (g/l) 2.0 2.0
- Acetic Acid (pH) 5.0 5.0
- Temperature (oC) 80 80
- Ultrasound Energy ~ 35 kHz - 60 min
- L:R 1:20 1:20
2.4.2.1.3 Procedure:
- Beaker (a) was set in the standard dye bath at 50 oC with Sandogen NH and Sodium Acetate, while beaker (b) was set in ultrasonic dye bath at 50 oC with Sandogen NH and Sodium Acetate then pH of the baths were adjusted and stirred for 10 mins.
- Then 5 ml dye was poured in beakers (a) and (b), after that 5 gm silk fabric was added to both of the beakers.
- Temperature of the dye bath was raised to 80 oC and dyeing was carried out for 60 mins with continuous stirring.
- At last the liquor of both the beakers was drained and the sample was washed with standard method.
2.4.2.1.4 Results:
Following are the CIE color lab (CMC tests) conducted on data color;
Following are the CIE color lab (CMC tests) conducted on data color;
| Name of dye | Control | Ultrasound |
| Lanasan Blue CF-B | 100 % | 104.46 % |
2.4.2.1.5 Conclusions
- Silk fabric when dyed with ultrasound energy gives high yield but the percentage yield in however in not much significant.


2.5 DISPERSE DYES
Disperse dyes are developed with the aim of solving the problems related to fiber irregularities during dyeing of polymers. Such dyes are non-ionic, carry no reactive or polar groups, and are intended to combine the favorable characteristics of disperse and reactive dyes.
2.5.1 Disperse RD Type dyes
2.5.1.1 Dyeing With Carriers
2.5.1.1.1 Methodology
2.5.1.1.1.1 Experiment Title:
Comparative study of Disperse Dyes (Foron Blue RD GLN) between CONTROL PROCESS (a), and EXPOSURE OF ULTRASOUND (b) using carriers, on 100% Polyester special twill weave by Exhaust Process.
2.5.1.1.1.2 Recipes Followed:……… (a)…….. (b)
- Foron Blue RD GLN (%) 1.0 1.0
- Lyocol RDN (g/l) 2.0 2.0
- Ramol R (Carriers) (g/l) 5.0 5.0
- Ammonium Sulphate (g/l) 2.0 2.0
- Acetic Acid (for pH) 5.0 – 5.5 5.0 – 5.5
- Ultrasound Energy ~ 35 kHz - 60 mins
- Liquor Ratio 1:20 1:20
- Temperature (oC) 90 80
2.5.1.1.1.3 Procedure:
- Control beaker (a) was set in the standard dye bath at 60 oC with required quantities of leveling, dispersing agents, carriers and ammonium sulphate, then stirred about 10 mins, after that pH of the bath was adjusted to 5.0 – 5.5.
- While ultrasonic beaker (b) was set at 60 oC with required quantities of leveling, dispersing agents, carriers and ammonium sulphate, then stirred about 10 mins, after that pH of the bath was adjusted to 5.0 – 5.5.
- Then dyestuff and fabric was added into both the beakers (a & b), and temperature of the baths were gradually raised to Control 90 oC and Ultrasonic 80oC.
- Dyeing was continued for about 60 mins along with the constant stirring.
- Then the liquor was drained and fabric was washed with the standard process.
2.5.1.1.1.4 Results:
| Name of dyes | Process | Control | Ultrasound |
| Foron Blue RD GLN | with carriers | 100 % | 86.18 % |
2.5.1.1.1.5 Conclusions:
- Dyeing of polyester substrate with carriers and ultrasonic exposure however showed no encourage able sign.


2.5.1.2 Dyeing Without Carriers
2.5.1.2.1 Methodology
2.5.1.2.1.1 Experiment Title:
Comparative study of Disperse Dyes (Foron Blue RD GLN) between CONTROL PROCESS (a), and EXPOSURE OF ULTRASOUND (b) without using carriers, on 100% Polyester special twill weave by Exhaust Process.
2.5.1.2.1.2 Recipes Followed: ….(a) …..(b)
2.5.1.2.1 Methodology
2.5.1.2.1.1 Experiment Title:
Comparative study of Disperse Dyes (Foron Blue RD GLN) between CONTROL PROCESS (a), and EXPOSURE OF ULTRASOUND (b) without using carriers, on 100% Polyester special twill weave by Exhaust Process.
2.5.1.2.1.2 Recipes Followed: ….(a) …..(b)
- Foron Blue RD GLN (%) 1.0 1.0
- Lyocol RDN (g/l) 2.0 2.0
- Ammonium Sulphate (g/l) 2.0 2.0
- Acetic Acid (for pH) 5.0 – 5.5 5.0 – 5.5
- Ultrasound Energy ~ 35 kHz - 60 mins
- Liquor Ratio 1:20 1:20
- Temperature (oC) 90 80
2.5.1.2.1.3 Procedure:
- Control beaker (a) was set in the standard dye bath at 60 oC with required quantities of leveling, dispersing agents and ammonium sulphate, then stirred about 10 mins, after that pH of the bath was adjusted to 5.0 – 5.5.
- While ultrasonic beaker (b) was set at 60 oC with required quantities of leveling, dispersing agents and ammonium sulphate, then stirred about 10 mins, after that pH of the bath was adjusted to 5.0 – 5.5.
- Then dyestuff and fabric was added into both the beakers (a & b), and temperature of the baths were gradually raised to Control 90 oC and Ultrasonic 80oC.
- Dyeing was continued for about 60 mins along with the constant stirring.
- Then the liquor was drained and fabric was washed with the standard process.
2.5.1.2.1.4 Results:
| Name of dyes | Process | Control | Ultrasound |
| Foron Blue RD GLN | without carriers | 100 % | 90.12 % |
2.5.1.2.1.5 Conclusions:
- Dyeing of polyester substrate without carriers and ultrasonic exposure however showed no encourage able sign.


2.5.2 Disperse SE Type dyes
2.5.2.1 Dyeing With Carriers
2.5.2.1.1 Methodology
2.5.2.1.1.1 Experiment Title:
Comparative study of Disperse Dyes (Foron Blue SE) between CONTROL PROCESS (a), and EXPOSURE OF ULTRASOUND (b) using carriers, on 100% Polyester special twill weave by Exhaust Process.
2.5.2.1.1.2 Recipes Followed: ….(a)…. (b)
- Foron Blue SE (%) 1.0 1.0
- Lyocol RDN (g/l) 2.0 2.0
- Ramol R (Carriers) (g/l) 5.0 5.0
- Ammonium Sulphate (g/l) 2.0 2.0
- Acetic Acid (for pH) 5.0 – 5.5 5.0 – 5.5
- Ultrasound Energy ~ 35 kHz - 60 mins
- Liquor Ratio 1:20 1:20
- Temperature (oC) 80 80
2.5.2.1.1.3 Procedure:
- Control beaker (a) was set in the standard dye bath at 60 oC with required quantities of leveling, dispersing agents, carriers and ammonium sulphate, then stirred about 10 mins, after that pH of the bath was adjusted to 5.0 – 5.5.
- While ultrasonic beaker (b) was set at 60 oC with required quantities of leveling, dispersing agents, carriers and ammonium sulphate, then stirred about 10 mins, after that pH of the bath was adjusted to 5.0 – 5.5.
- Then dyestuff and fabric was added into both the beakers (a & b), and temperature of both the baths were gradually raised to 80 oC.
- Dyeing was continued for about 60 mins along with the constant stirring.
- Then the liquor was drained and fabric was washed with the standard process.
2.5.2.1.1.4 Results:
| Name of dyes | Process | Control | Ultrasound |
| Foron Blue SE | with carriers | 100 % | 125.87 % |
2.5.2.1.1.5 Conclusions:
- Disperse SE type dyes when dyed with carriers and ultrasonic exposure, the comparative percentage yield of ultrasonic sample was significantly higher than control one.
- Hence with the same amount of dyes and chemicals, deeper shades can be dyed with ultrasonic energy.


2.5.2.2 Dyeing Without Carriers
2.5.2.2.1 Methodology
2.5.2.2.1.1 Experiment Title: Comparative study of Disperse Dyes (Foron Blue SE) between CONTROL PROCESS (a), and EXPOSURE OF ULTRASOUND (b) without using carriers, on 100% Polyester special twill weave by Exhaust Process.
2.5.2.2.1.2 Recipes Followed: ……(a) …..(b)
2.5.2.2.1 Methodology
2.5.2.2.1.1 Experiment Title: Comparative study of Disperse Dyes (Foron Blue SE) between CONTROL PROCESS (a), and EXPOSURE OF ULTRASOUND (b) without using carriers, on 100% Polyester special twill weave by Exhaust Process.
2.5.2.2.1.2 Recipes Followed: ……(a) …..(b)
- Foron Blue SE (%) 1.0 1.0
- Lyocol RDN (g/l) 2.0 2.0
- Ammonium Sulphate (g/l) 2.0 2.0
- Acetic Acid (for pH) 5.0 – 5.5 5.0 – 5.5
- Ultrasound Energy ~ 35 kHz - 60 mins
- Liquor Ratio 1:20 1:20
- Temperature (oC) 80 80
2.5.2.2.1.3 Procedure:
- Control beaker (a) was set in the standard dye bath at 60 oC with required quantities of leveling, dispersing agents and ammonium sulphate, then stirred about 10 mins, after that pH of the bath was adjusted to 5.0 – 5.5.
- While ultrasonic beaker (b) was set at 60 oC with required quantities of leveling, dispersing agents and ammonium sulphate, then stirred about 10 mins, after that pH of the bath was adjusted to 5.0 – 5.5.
- Then dyestuff and fabric was added into both the beakers (a & b), and temperature of both the baths were gradually raised to 80 oC.
- Dyeing was continued for about 60 mins along with the constant stirring.
- Then the liquor was drained and fabric was washed with the standard process.
| Name of dyes | Process | Control | Ultrasound |
| Foron Blue SE | without carriers | 100 % | 123.66 % |
2.5.2.2.1.5 Conclusions:
- Disperse SE type dyes when dyed without carriers and ultrasonic exposure, the comparative percentage yield of ultrasonic sample was significantly higher than control one.
- Hence with the same amount of dyes and chemicals, deeper shades can be dyed with ultrasonic energy. With no much difference between this and last results, consumption of carriers can be saved or either added little to be on safe side.


2.5.3.1 Dyeing With Carriers
2.5.3.1.1 Methodology
2.5.3.1.1.1 Experiment Title:
Comparative study of Disperse Dyes (Foron Turquoise S GB) between CONTROL PROCESS (a), and EXPOSURE OF ULTRASOUND (b) using carriers, on 100% Polyester special twill weave by Exhaust Process.
2.5.3.1.1.2 Recipes Followed:………… (a)……… (b)
- Foron Turquoise S GB (%) 1.0 1.0
- Lyocol RDN (g/l) 2.0 2.0
- Ramol R (Carriers) (g/l) 5.0 5.0
- Ammonium Sulphate (g/l) 2.0 2.0
- Acetic Acid (for pH) 5.0 – 5.5 5.0 – 5.5
- Ultrasound Energy ~ 35 kHz - 60 mins
- Weight of fabric (gm) 5.0 5.0
- Liquor Ratio 1:20 1:20
- Temperature (oC) 80 80
- Control beaker (a) was set in the standard dye bath at 60 oC with required quantities of leveling, dispersing agents, carriers and ammonium sulphate, then stirred about 10 mins, after that pH of the bath was adjusted to 5.0 – 5.5.
- While ultrasonic beaker (b) was set at 60 oC with required quantities of leveling, dispersing agents, carriers and ammonium sulphate, then stirred about 10 mins, after that pH of the bath was adjusted to 5.0 – 5.5.
- Then dyestuff and fabric was added into both the beakers (a & b), and temperature of both the baths were gradually raised to 80 oC.
- Dyeing was continued for about 60 mins along with the constant stirring.
- Then the liquor was drained and fabric was washed with the standard process.
Following are the CIE color lab (CMC tests) conducted on data color;
| Name of dyes | Process | Control | % Dye uptake |
| Foron Turquoise S GB | with carriers | 100 % | 87.88 % |
2.5.3.1.1.5 Conclusions:
- Dyeing of polyester substrate with carriers and ultrasonic exposure however showed no encourage able sign.


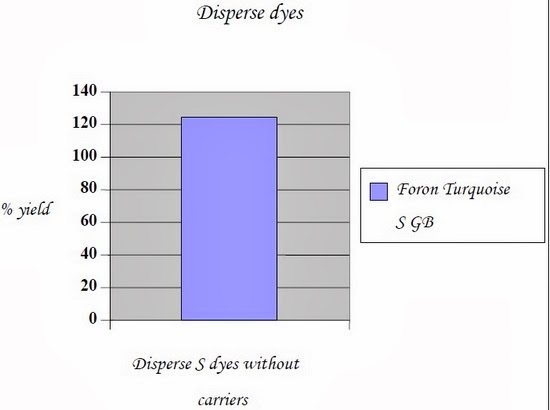
2.5.3.2.1 Methodology
2.5.3.2.1.1 Experiment Title:
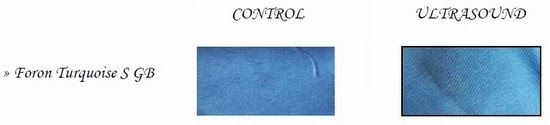
Comparative study of Disperse Dyes (Foron Turquoise S GB) between CONTROL PROCESS (a), and EXPOSURE OF ULTRASOUND (b) without using carriers, on 100% Polyester special twill weave by Exhaust Process.
2.5.3.2.1.2 Recipes Followed: ….(a)……. (b)
- Foron Turquoise S GB (%) 1.0 1.0
- Lyocol RDN (g/l) 2.0 2.0
- Ammonium Sulphate (g/l) 2.0 2.0
- Acetic Acid (for pH) 5.0 – 5.5 5.0 – 5.5
- Ultrasound Energy ~ 35 kHz - 60 mins
- Liquor Ratio 1:20 1:20
- Temperature (oC) 80 80
- Control beaker (a) was set in the standard dye bath at 60 oC with required quantities of leveling, dispersing agents and ammonium sulphate, then stirred about 10 mins, after that pH of the bath was adjusted to 5.0 – 5.5.
- While ultrasonic beaker (b) was set at 60 oC with required quantities of leveling, dispersing agents and ammonium sulphate, then stirred about 10 mins, after that pH of the bath was adjusted to 5.0 – 5.5.
- Then dyestuff and fabric was added into both the beakers (a & b), and temperature of both the baths were gradually raised to 80 oC.
- Dyeing was continued for about 60 mins along with the constant stirring.
- Then the liquor was drained and fabric was washed with the below mentioned steps.
Following are the CIE color lab (CMC tests) conducted on data color;
Name of dyes | Process | Control | Ultrasound |
Foron Turquoise S GB | without carriers | 100 % | 124.33 % |
2.5.3.2.1.5 Conclusions:
- Result concludes that, dyeing on polyester fabric exposed by ultrasonic energy without carriers gives considerably more yield if compared with conventional dyeing process keeping all parameters constant.
- Actually ultrasonic energy swells the compact structure of polyester without the presence of carriers and penetration of dyestuff became much easier.
- Hence with the same amount of dyes and chemicals, deeper shades can be dyed with ultrasonic energy.
Basic dye is a class of dyes, usually synthetic, that act as bases, and which are actually aniline dyes. Their color base is not water soluble but can be made so by converting the base into a salt. The outstanding characteristic of the basic dyes is the brilliance and intensity of their colors. Some of the shades are of such clarity of hue that no other class can compare with them.
2.6.1 Dyeing on Acrylic
2.6.1.1 Methodology
2.6.1.1.1 Experiment Title:
Comparative study of Cationic or Basic dyes between CONTROL PROCESS (a), and EXPOSURE OF ULTRASOUND (b), on Acrylic fabric by Exhaust Process.
2.6.1.1.2 Recipes Followed: ….(a)….. (b)
- Sandocryl (%) 1.0 1.0
- Glauber’s salt (%) 15 15
- Acetic acid (ml) 1.0 1.0
- pH 4-4.5 4-4.5
- Ultrasound Energy ~ 35 kHz - 60 mins
- Liquor Ratio 1:20 1:20
- Temperature (oC) 80 80
- Control beaker (a) was set in the standard dye bath at 60 oC with required quantities of leveling, dispersing agents, carriers and ammonium sulphate, then stirred about 10 mins, after that pH of the bath was adjusted to 5.0 – 5.5.
- While ultrasonic beaker (b) was set at 60 oC with required quantities of leveling, dispersing agents, carriers and ammonium sulphate, then stirred about 10 mins, after that pH of the bath was adjusted to 5.0 – 5.5.
- Then dyestuff and fabric was added into both the beakers (a & b), and temperature of the baths were gradually raised to Control 90 oC and Ultrasonic 80oC.
- Dyeing was continued for about 60 mins along with constant stirring.
- Then the liquor was drained and fabric was washed with the standard process.
Following are the CIE color lab (CMC tests) conducted on data color;
Name of dyes | Control | Ultrasound |
Sandocryl | 100 % | 114.24 % |
2.6.1.1.5 Conclusions:
- Result shows that, dyeing on acrylic fabric by cationic or basic dyestuff with ultrasonic energy gives more yield if compared with conventional dyeing process keeping all parameters constant.
- Hence, consumption of dyes and chemicals can be substantially reduced.


2.7.1 Discontinuous washing
Assuming that ultrasonic energy creates agitation in the fluid, which causes efficient washing of textiles, following experiments was conducted;
2.7.1.1 Methodology
2.7.1.1.1 Experiment Title:
Comparative study of Discontinuous washing between CONTROL PROCESS (a), and EXPOSURE OF ULTRASOUND (b) using 100% cotton woven and knitted fabrics.
2.7.1.1.2 Process 1 ……..(a) ……….(b)
- Cold rinsing (min) 5.0 5.0
- Hot rinsing (min) 5.0 5.0
- Soaping (min) 5.0 5.0
- Hot rinsing (min) 5.0 5.0
- Ultrasound Energy - 35 kHz
- Temperature (oC) 60 60
2.7.1.1.3 Procedure:
- Dyed + stained and bleached + stained samples for control (a) & ultrasound (b) was thoroughly rinsed with cold water for 5 minutes.
- After rinsing both the samples were cut into two parts for control (a) & ultrasound (b).
- One portion of the sample was hot rinsed at 60 oC in control process (a) for 5 minutes while the other piece of sample was hot rinsed at 60 oC in ultrasound exposure (b) for 5 minutes.
- Then both the samples (a & b) were soaped at 60 oC for 5 minutes in control process (a) & ultrasound exposure (b) respectively.
- After soaping the samples were again hot rinsed at 60 oC for 5 minutes in control process (a) & ultrasound exposure (b) respectively.
- Finally both samples of (a & b) are rinsed thoroughly with cold water.
- Cold rinsing (min) 10 10
- Hot rinsing (min) 10 10
- Soaping (min) 10 10
- Hot rinsing (min) 10 10
- Ultrasound Energy - 35 kHz
- Temperature (oC) 60 60
2.7.1.1.5 Procedure:
- Dyed + stained and bleached + stained samples for control (a) & ultrasound (b) was thoroughly rinsed with cold water for 10 minutes.
- After rinsing both the samples were cut into two parts for control (a) & ultrasound (b).
- One portion of the sample was hot rinsed at 60 oC in control process (a) for 10 minutes while the other piece of sample was hot rinsed at 60 oC in ultrasound exposure (b) for 10 minutes.
- Then both the samples (a & b) were soaped at 60 oC for 10 minutes in control process (a) & ultrasound exposure (b) respectively.
- •After soaping the samples were again hot rinsed at 60 oC for 10 minutes in control process (a) & ultrasound exposure (b) respectively.
- Finally both samples of (a & b) are rinsed thoroughly with cold water.
| Samples | Process 1 | Process 2 | ||
| status | Control process(a) | Ultrasound exposure(b) | Control process(a) | Ultrasound exposure(b) |
| Dyed + stain sample | Light spots of stain | No spots of stain | Stains are removed | Stains are removed |
| Less removal of unfixed dyestuff | Better removal of unfixed dyestuff | Better removal of unfixed dyestuff | Good removal of unfixed dyestuff | |
| Knitted bleached + stain & yellowish | Less removal of stains | Better removal of stains | Few spots of stains | No stains |
| Light yellowish | No yellowish, it becomes white | Less yellowish | No yellowish, it is perfect white | |
| Woven bleached + stain & yellowish | Very Less removal of stains | Less removal of stains | Light stain spots were removed but heavy spots still remain | No stains |
| It remains yellowish | No yellowish, it becomes white | Less yellowish | No yellowish, it is perfect white | |
Results clear that
- Ultrasonic energy escalates the washing efficiency of dyed or stained either knitted or woven fabrics.
- Agitation provided by the ultrasonic waves in fluid fastens the process of removal of stains and unfixed dyestuff.
- Thus, in the way detergents, energy and time all can be saved through ultrasonic aided washing.


No Responses to "Application of Ultrasonic in Textile Wet Processing (Part-2)"