Halo Sobat ! | Members area : Register | Sign in
About me | SiteMap | Arsip | Terms of Use | Dcma Disclaimer

Footer

Powered by Blogger.

Social Icons

Featured Posts

Slider(Do not Edit Here!)

Minha lista de blogs

Publicidade 2

Cantinho do Blog

Parcerias

Hospedagens FREE

Dominios FREE

Publicidade 1

widget

Pojok Blog

Arsip

Sample text

Sample Text

Sample Text

Powered By Blogger
Powered By Blogger
Powered By Blogger

Perangkat SD

Perangkat SMP

Berita Pendidikan

Pengumuman

..::Aprendiz MUOnline::..

..::Ultimate Vendas::..

..::Central MU Online::..

..::Criando Portais::..

..::Viciados MU::..

..::Universe Divulgação::..

Visitor Counter

Google Search

..::Mixer Divulgação::..

You can replace this text by going to "Layout" and then "Page Elements" section. Edit " About "

..::Rádios Online::..

Recent Comments

..::Melhor Divulgação::..

..::Vermelho Divulgação::..

..::Extreme Divulgação::..

..::Control Downs::..

..::Divulgaçao::..

..::FreeXat parceiro top::..

..::Ciados MU Online::..

..::Nosso Banner no seu Site::..

About Me-

Seguidores

Seguidores

Social Icons

Musik

Translate

..::Majestic Hacker::..

..::Exclusivo MU Online::..

Translate to your language

Fox Life

Pages

Pages

Publicidade

Parceiros

Social Icons

Fabric Weight Measurement Technique

Monday, 3 March 2014

FABRIC WEIGHT:
Fabric weight is a most important characteristics of a fabric .It is required to confirm about the fabric weight of a finish fabric otherwise we cannot revert when garments is made .
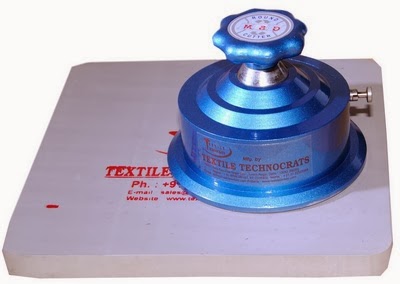
GSM Cutter
PURPOSE :
To make a representative assessment of the mass per unit area in grams per square meter of a fabric.

APPARATUS:
  1. Circular Sample cutter capable of giving a specimen area of 100cm2+/- 1 cm2.
  2. Weight balance
  3. Cutting board .
Sample Cutter Check:
Check your sample cutter by yourself with a simple method .Cut a white page and fold it and measure by mm steel ruler . If it is 112.6 mm and above then your cutter is ok to get accurate result .

Sample cutter check
It is a little mathematics  :
The area of a circle is calculated by multiplying the square of the radius by Ï€ (3.141592…)

So if the diameter is 113 mm, the radius will be 113/2 = 56.5. The area of the specimen you cut will therefore be 56.5 x 56.5 x 3.141592 = 100.29 sq cms.

You are looking for Grams per Square Meter. The area of

1 square metre is 100 x 100 square cms = 10,000 sq cms.

Therefore if you divide 10,000 by the area of the specimen you have cut, you will get

   10,000 / 100.29 

= a factor of 99.71.

Therefore if you multiply the weight of the specimen by 99.71 you will get the Grams per Square Meter. Most people multiply by 100, so, when they read the result from the balance they automatically just move the decimal point two places to the left.

As an illustration suppose the specimen weights 1.85grams, the GSM will be 1.85 x 100 = 185 grams per square metre.

If you multiplied by 99.71 the result would be 1.85 x 99.71 = 184.46 grams per square metre.

Because of variations in the cutting performance of different fabrics the O.29grams does not really play a significant role in the accuracy of the test result and most performance requirements anyway give a tolerance of maybe +- 2/3%.

Measuring and Predicting Fabric and Garment Drape

Monday, 10 February 2014

Measuring and Predicting Fabric and Garment Drape

Rahamat Ullah Joy
B.sc in Textile Engineering
Daffodil International University
Facebook: Rahamat Ullah Joy
Email: rahamat.tex@gamil.com
Phone: +8801614445257


Introduction :
A critically important, in fact essential, property of a textile fabric and one which distinguishes it from other materials, such as paper or steel, is its ability to undergo large, recoverable draping deformation by buckling gracefully into rounded folds of single and double curvature. It is this characteristic that plays a critical role in the fit, body conformation and wear comfort of garments and when translating three-dimensional (3D) body shapes into two-dimensional (2D) patterns and vice versa. According to the Textile Terms and Definitions of the Textile Institute, “Drape is defined as ‘the ability of a fabric to hang limply in graceful folds, e.g. the sinusoidal-type folds of a curtain or skirt’. It refers to the fabric shape as it hangs under its own weight; Cusick defined the drape of a fabric as ‘a deformation of the fabric produced by gravity when only part of the fabric is directly supported’. Drape, together with the effect of seams, determines the way in which a garment moulds itself to the shape of the body, this being a critical factor in comfort and aesthetic-related aspects of a garment and its fit. Ayada and Niwa4 showed that the visual beauty and total quality of gathered skirts are closely related to the fabric mechanical properties of bending, shear and fabric weight and can be described by the parameters of formability, elastic potential and drape.

Drape, in which the fabric shearing properties play a dominant role, is also a critically important parameter in the application of body scanning, mass customisation, computer-aided design and computer-aided manufacturing (CAD-CAM) and automatic pattern making to clothing design and manufacturing. The most significant developments in recent years have been the empirical prediction and modelling of drape as well as the move towards 3D design, simulation and virtual modelling (3D virtual prototyping) which enables the designer to ‘drape and validate’ their design onto a computergenerated manikin or one built off a body scan of a fit model, taking into account technical information, fabric type, colour, drape and stretch as well as the effect of seams. Transforming 2D patterns into a 3D configuration that follows a body surface (and vice versa), of necessity, involves modelling the fabric physical properties such as drape.

Measurement of Drape
Fabric drape characteristics and behaviour are manifested in the appearance and fit of the garment and are usually assessed subjectively. Nevertheless, considerable research and development has been directed to the routine objective measurement and characterisation of drape and to relate drape, so measured, to objectively measured fabric mechanical properties, notably bending stiffness and shear stiffness. Chung presented a detailed review of studies on drape, both static and dynamic, on both unseamed and seamed fabrics, and investigated the effect of seam allowance, type and position on woven fabric drape. She found that bending length increased with the insertion of a vertical seam, while drape coefficient increased with the addition of radial seams; increasing the seam allowance had little effect. The highest drape coefficient occurred with the circular seam located just out of the pedestal. Schenk developed a new method to measure the effect of seam stiffness on the stiffness of adjacent fabrics.
Cusick’s Drapemeter
Pioneering work was carried out by Chuetal who developed a method of measuring drape by means of the F.R.L. Drapemeter, quantifying drape as a dimensionless drape coefficient (DC%). Cusick subsequently developed what has become known as Cusick’s drapemeter (Fig.) and which is still the standard and most common method of measuring drape. It has a parallel light source that causes the shape of the draped fabric to be projected onto a circular paper disc. The drape of a fabric is popularly defined as the area of the annular ring covered by the vertical projection of the draped fabric expressed as a percentage of the area of the flat annular ring of fabric, this being termed the ‘drape coefficient’. In practice, the contour of the shadow is often traced onto the paper and cut out for weighing. Cusick defined the drape coefficient (DC%) as the weight of the paper of the drape shadow (W2) expressed as a percentage of the paper weight (W1) of the area of the full annular ring DC% = W2/W1 × 100 

Bhatia and Phadke10 stated that since the draped sample will form pleats it will not remain in one plane and that the traced image is not necessarily the true projected one. They stated that understanding the drape mechanism requires a study of the following factors.
  • The drape geometry, i.e. the configuration of the draped sample, the drape measurement being employed to study the effects of fabric geometry.
  • The drape diagrams, i.e. the projected 2D simplification of the 3D draped sample, which contains three significant items:
  • the area, which is the basis of the drape coefficient;
  • the number of nodes – formed as a result of material buckling, the phenomenon of buckling, the type of load applications and the boundary conditions;
  • the shape of the nodes – when the nodes are uniform, the drape diagram is a cyclic function in polar co-ordinates. Converting these polar coordinates into rectangular co-ordinates simplifies the analysis between the shape factor and the drape coefficient.
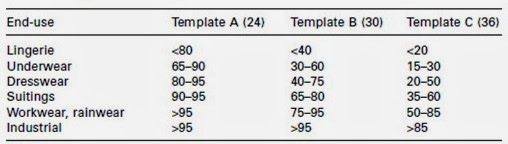
Table: Drape coefficients (%)
The drape geometry is predictable from the drape coefficient, the number of nodes decreasing as the drape coefficient increases (inverse relationship).Behera and Mishra found a negative correlation between the number of nodes and fabric bending rigidity.

Typical examples of ‘drapemeters’ include those of Cusick, F.R.L. and I.T.F., and the M.I.T. Drape-O-Meter. Other principles of measuring drape include the force to pull a circular fabric sample at a constant speed through a ring, the force being termed the ‘drape resistance’ of the fabric. Collier developed a digital drapemeter. Matsudaira et al. used an image analysis system to measure static and dynamic drape. Vangheluwe and Kiekens also used image analysis (video digital camera and computer-based image processing system) to measure the drape coefficient, while Stylios et al. developed the next generation of drapemeters, enabling 3D static and dynamic drape to be measured by means of a charge-coupled device (CCD) camera as a vision sensor. Image analysis enables many measurements to be made in a relatively short time. The following are some of the standard test methods used to measure fabric drape:
  • BS 8357;
  • BS 5058/EN 9073;
  • UNI 8279;
  • AFNOR G07-109;
  • ERT 90-1.
Some factors contributing to fabric drape behaviour. Direction of arrows indicates whether an increase or decrease in a given parameter will produce an increase in the drape coefficient of the fabric.
Another factor: Empirical prediction of drape
A number of experimental studies have been undertaken to identify those fabric properties that affect drape and to quantify such effects empirically, by means of regression equations and other analytical techniques. Peirce carried out one of the earliest studies on fabric drape, early studies demonstrating the dominant role of fabric stiffness on drape, fabric weight playing a lesser role. Chu et al. showed that drape depended upon three basic fabric properties, namely Young’s modulus (Y), cross-sectional moment of inertia (I) and fabric weight (W) [drape coefficient = f(B/W), where B = YI].

Later studies demonstrated the effect of fabric shear and also shear hysteresis on drape for both woven and knitted fabrics, ‘shearing’ being the deformation that results in a flat fabric when opposing forces act parallel to each other (shear stiffness being the shear angle at which a fabric begins to buckle). Xu and Wang derived the following prediction equations for the shearing rigidities of worsted fabrics with short floats (e.g. plain, 2/1 twill, 1/2 twill and 2/2 twill)

Last content :
Initially, work on drape concentrated on its accurate measurement and on the empirical prediction of drape from the fabric mechanical properties, notably bending and shear rigidity and hysteresis. More recently, however, attention has increasingly focused on modelling garment drape, this being important for developing 3D garment CAD systems. Ideal drape models should not only be able to display the static drape of the garment realistically with 3D renderings of design features, colours and surface textures, but simulate the animated dynamic drape. It should have the capability to convert 3D shapes into 2D patterns or vice versa. Although most apparel CAD systems or drape models on the Internet are claimed to present realistic draping effects, the real performance needs to be evaluated by the end user.

Significant improvements in the drape models have occurred over the past two decades; however, further development in this area is still needed. As Wentzel pointed out, ‘the imagery of the virtual 3D sample is still flat; the stand and garment look somewhat sterile. Although fabric coefficients can be entered, the representation of the fabric drape still leaves some room for improvement.’ When 3D animation is to be achieved, the challenge is greater. The resolution of the 3D virtual garment is still low in real-time presentation. Owing to the complexity and high polygon calculation, it takes a long time to achieve accurate performance of 3D animation. When the virtual garment is presented in a dynamic way or in 360° rotation, the figure tends to show a lot of shading and poor texture effects.

What are the Reasons for Textile Testing

Saturday, 1 February 2014

REASONS FOR TEXTILE TESTING
The testing of textile products is an expensive business. A laboratory has to be set up and furnished with a range of test equipment. Trained operatives have to be employed throughout the year. All these costs are nonproductive and therefore add to the final cost of the product. There are a number of points in the production cycle where testing may be carried out to improve the product.
  1. Checking Raw Materials
  2. Monitoring Production
  3. Assessing the Final Product
  4. Investigation of Faulty Material
  5. Product Development and Research
Greige Fabric Faults
The greige fabric faults can be categorized into the followings;
  1. Spinning Faults
  2. Warping Faults
  3. Sizing Faults
  4. Production Faults
  5. Maintenance Faults
1) Spinning Faults
  • Black Ends
  • Count Variation
  • Shade Variation
  • Cockled Yarn
  • Polypropylene
2) Warping Faults
  • Extra End/ Double End
  • Loose End
3) Sizing Faults
  • Hard Size/ Size Hole/ Over Size
  • Sizing Stains
  • Sizing Balls/Beeds
4) Production Faults
  • Miss Pick
  • Double Pick
  • Hanging Thread
  • Wrong Drawing
  • Wrong Denting
  • Count Mix
  • Broken End/ Short End
5) Maintenance Faults
  • Starting marks
  • Repping mark
  • Nozzle mark
  • Temple mark
  • Temple cuts (warp/weft cuts)
  • Let off mark
  • Shadow
  • Lashing in
  • Floats
  • Reed cuts
  • Reed mark
  • Oil/grease stains
  • Weft loose
  • Short double picks
  • Reediness
  • Needle top
  • Needle mark
  • Short miss picks
  • Crack
  • Snarling
ABRASION RESISTANCE
“The resistance offered by the fabric against the production of pills is called as abrasion resistance.”

Factors Affecting Abrasion Resistance

The factors that have been found to affect abrasion resistance include the following:
  1. Fiber Type
  2. Fiber Properties
  3. Yarn Twist
  4. Fabric Structure
ABRASION TESTS
Factors Affecting Abrasion Tests
The factors which can affect the results of an abrasion test are the following.
  1. Type of Abrasion.
  2. Type of Abradant
  3. Pressure
  4. Speed
  5. Tension
  6. Direction of Abrasion
Snagging
“A snag is a loop of fiber that is pulled from a fabric when it is in contact with a rough object.” Snags detract (take away) from the appearance of the fabric but do not reduce its any other property.

Fabrics made from bulked continuous filament yarns and woven fabrics with long floats suffer this problem (snagging).

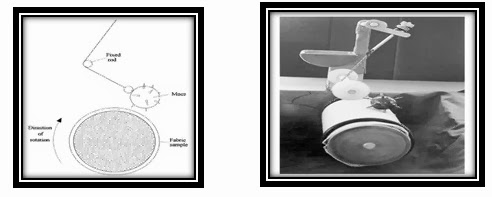
Mace Snagging Test
The mace snagging test is a comparative test for the snagging of knitted fabrics of textured polyester yarn. In the test a metal ball fitted with spikes bounces randomly against a sleeve of the test fabric as it rotates. The spikes only catch the loops of threads that are lying in a particular position, so that it is important to test both directions of a fabric.
        The Mace Snagging Test                  One Station of a Mace Snagging Tester
Creasing of Fabrics

Crease Angle
“The angle between two limbs of a sample after creasing under standard conditions is called crease angle.” This angle is the measure of resistance of fabric to creasing.

Crease Resistance
“The ability of textile fabric due to which it resists against deformation in its shape is known as crease resistance.” (More resistance means less crease production.)

Crease Recovery
“The power of textile fabric to recover from creasing in known as crease recovery”

Crease Resistant Material
“The material which resist creasing or any deformation in their shape is called crease resistant material.” The descending order of crease resistant materials is shown below;
  1. Wool
  2. Silk
  3. Acetate rayon
  4. Cuprammonium rayon
  5. Viscose rayon
  6. Cotton
  7. Flax
Measurement of Crease Resistance
1) Circular Dial Apparatus

Working Principle

“The crease ability of a fabric is measured by gripping one arm of previously creased sample near to the crease so that other arm hangs vertically, and then crease angle is observed.”

Crease Recovery % = (crease angle/180) * 100 

2) The Tootal Test

Fabric Stiffness

Stiffness
“The resistance of the fabric against bending is called stiffness.” If the length of fabric bends easily, then it is less stiff and vice versa.

The stiffness of the fabric is associated with the following parameters;
  1. Handle
  2. Drape
  3. Fullness or paperiness
The above properties are dependent on the following parameters:
  • Yarn T.P.I (yarn TPI stiffness)
  • Fabric Design (plain weave (1 1) is less rigid than twill, satin, sateen, etc.)
  • Count of warp and weft (count stiffness)
  • Density of warp and weft (density of warp/weft stiffness)
    Stiffness test
    Test Equipments for Fabric Stiffness

  1. Shirley Stiffness Tester
  2. Loop Method
Pilling of Fabrics
Pilling
“A little fuzz ball or pills of entangled fibers, formed during wear and washing of the garment due to protruding fibers is called pilling.”
A pill is formed due to the migration of the fibers in the yarn. It is clear that the prevention or reduction of the pilling is affected by reducing migratory behavior of the fibers. The migratory behavior of the fibers is reduced by the followings;
  • Higher twist factor in yarn
  • Brushing and cropping of the fabric surface
  • Special chemical treatment (cellulose for the cotton fabric)
  • Longer staple length of the fiber
Pilling Test Methods
Two types of instruments are used for determination of pilling of fabric;
  1. Martindale Pilling Tester
  2. ICI Pilling Box
Seam Strength
It is often seen that the fabric is in good condition but seam failure make this fabric unusable. There are a number of causes of seam failure but some of them are;
  1. Yarns making up the fabric are broken or damaged by needle during sewing
  2. Seam slippage occurs
  • For apparel manufacturing, seam slippage is an important factor
  • Seam failure in fabric depends upon
  • The sewing thread
  • The sewing speed
  • Size of sewing needle
  • Stitch length
Tests for Seam Slippage
1) Fixed Load Method:
Seam Efficiency = (Seamed Clothed Strength / Unseamed Cloth Strength)* 100 

2) Load Extension Curve Method / Variable Load Method

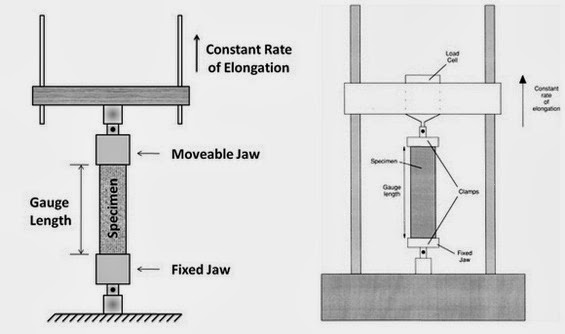
Tensile Strength
“The breaking strength of given textile material when stretched along length is known as tensile strength.”

The breaking strength of a fabric is expressed in Newton. It can be measured by two methods;
  • The Strip Test
  • Grab Test
The Strip Test:
Strip Test
Tearing Strength
“A fabric tears when it is snagged by a sharp object and the immediate small puncture is converted into a long rip”

Tear Tests
  1. Single Rip Tear Test/ Tongue Tear Test/ The Trouser Tear Test
  2. Double Rip Tear Test/ Tongue Tear Test
  3. Wing Rip Tear Test
  4. Elmendorf Tear Test
  5. Ballistic Tear Test
COLOR FASTNESS
“It is a resistance offered by a fabric to change in its color.”

Color Fastness to Rubbing
RUBBING:
“Movement of one surface over another is called as rubbing.”

Principle:
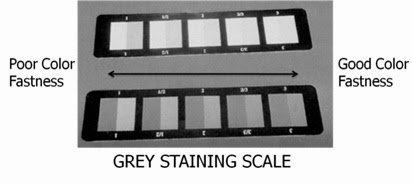
“A white crocking cloth is rubbed against the test specimen and the amount of color transferred from the test specimen to the white crocking cloth is assessed using grey staining scale and grading is done to that scale.”

Crocking (Color Fastness to Crocking)

“The transfer of color from the test sample to the adjacent fabric in the process of rubbing is termed as crocking.”
Grey scale
Color Fastness to Washing (By ISO Test No. 01)
Principle:

“The fastness of a died or printed fabric is checked by washing the specimen at specific standard conditions of temperature and for specific time and the change in color is assessed by comparing with the grey staining scale.”

Study on Air Permeability and Porosity of Fabric

Saturday, 3 August 2013

Study on Air Permeability and Porosity of Fabric

Selim Hossain
Department of Textile Engineering
Daffodil International University
Email: selim_1999@diu.edu.bd


INTRODUCTION
Permeability is a measure of the ability of a porous material to transmit fluids. It is an important property of technical textiles particularly in protective applications, such as auto and wearable airbags where even the low permeability of the fabric can extend the interactive time in impact. Limited permeability of parachute fabric can stabilise its descent, as shown in Figure: 1
Figure :1 Fabric permeability in protective applications
Fabric permeability relates to its geometric structure strongly as well as to the path of streamlines for flow through the structure. Therefore, development of an analytical fabric permeability model requires a background of fluid mechanics and knowledge of mechanics of textile fabrics.

Permeability is dependent upon the porosity of the fabric. The porosity is largely determined by the tightness of the fabric weave. Therefore any fabric that has reasonably tight weave is suitable for this perspective.

Air Permeability
The air permeability of a fabric is a measure of how well it allows the passage of air through it. The ease or otherwise of passage of air is of importance for a number of fabric end uses such as industrial filters, tents, sailcloth, parachutes, raincoat materials, shirting’s, down proof fabrics and airbags.

Air permeability is defined as the volume of air in milliliters which is passed in one second through 10Os mm2 of the fabric at a pressure difference of 10mm head of water.

In the British Standard test the airflow through a given area of fabric is measured at a constant pressure drop across the fabric of 10mm head of water. The specimen is clamped over the air inlet of the apparatus with the use of rubber gaskets and air is sucked through it by means of a pump as shown in Fig. 2. The air valve is adjusted to give a pressure drop across the fabric of 10mm head of water and the air flow is then measured using a flow meter.

Five specimens are used each with a test area of 508mm2 (25.4mm diameter) and the mean air flow in ml per second is calculated from the five results. From this the air permeability can be calculated in ml per 100mm2 per second.

The reciprocal of air permeability, air resistance, can be defined as the time in seconds for ImI of air to pass through 100s mm2 of fabric under a pressure head of 10mm of water. The advantage of using air resistance instead of air permeability to characterize a fabric is that in an assembly of a number of fabrics, the total air resistance is then the sum of the individual air resistances.

To obtain accurate results in the test, edge leakage around the specimen has to be prevented by using a guard ring or similar device (for example, efficient clamping). The pressure drop across the guard ring is measured by a separate pressure gauge. Air that is drawn through the guard ring does not pass through the flow meter.
Fig :2 The air permeability test
The pressure drops across the guard ring and test area are equalised in order that no air can pass either way through the edge of the specimen. A guard ring of three times the size of the test area is considered sufficient.

OBJECTIVES:

The high values of thermal resistance (R(ct)) and/or vapor resistance (R(et)) of chemical protective clothing (CPC) induce a considerable thermal stress. The present study compared the physiological strain induced by CPCs and evaluates the relative importance of the fabrics’ R(ct), R(et), and air permeability in determining heat strain.

Air permeability of fabrics with various densities

Air permeability measuring instrument
Most woven fabrics such as those used for apparel, domestic and light industrial application are of relatively open construction. Measuring the air permeability of such fabrics can be carried out at low pressure differences and a number of instruments are available for the purpose. In contrast, some materials such as leather, certain types of coated fabrics, and fabrics created for operating at increased pressure levels necessitate measuring their air permeability at appropriately high pressure levels that standard instruments are not able to provide. An instrument capable of testing up to 300 kPa was designed and built to address this need.

Method:
An approach analogous to that employed in electrical technology for measuring high resistance values was used, where a pre-charged capacitor is discharged through a resistor and the rate of decrease in current flow determined for calculating the resistance. Similarly in this instrument, a tank of sufficient capacity, pre-charged to a suitable pressure level is used to supply air to a fabric sample. As the air leaks through the fabric, the pressure in the tank drops. Measurement of the rate of drop in pressure in the tank enables calculation of the airflow rate through the fabric at a given pressure.

Fabrics that are appropriate for measurement by this technique have generally reduced air permeability on account of their tighter structures or other processes to which they are subjected and make the use of standard flow measuring instrumentation difficult to use. Figure 1 shows the basic construction of the instrument. The tank T is supplied with filtered dry air through a filter/drier F and electrically controlled pressure regulator R. Solenoid valve V1 is used to stop the airflow into the tank once the tank is charged to the required pressure. The pressure in the tank can be varied between 0.05 bar (gauge) to 3 bar. The tank can be connected to the test area through the pilot controlled solenoid valve V2 comprising of the lower clamp C1 and the upper (movable) clamp C2. Clamp C2 is controlled by an electric linear actuator so as to produce the required level of clamping force. A high response pressure transducer G1 is connected to the lower test clamp to enable the measurement of the air pressure applied to the fabric. Valve V2 has a large port area, in order for pressure loss across to be rendered negligible so that when V2 is open the reading of G1 is also very closely the pressure in the tank. There is also a low pressure transducer G2 (not shown) connected to the lower clamp. G2 is actually connected through a separate solenoid valve, so that when high pressure testing is carried out, it is isolated from the test area. G2 is provided in order that low pressure testing of fabrics can also be carried out on the same instrument. The tank can be flushed clean of any condensate using drain valve D. The pressure transducers are interfaced to a PC to enable logging of pressure data during testing. An optical proximity sensor P attached to the upper clamp to enable the measurement of distension of fabrics under pressure. The sensor employed is based on a linear optical array.

In the current configuration the test pressure can be up to 300 kPa. The test area is 50 cm2 . The optical proximity sensor can measure the distension of the specimen during testing.

Testing can be carried out in two ways. The tank can be pre-charged to the required test pressure, and the pressure can be applied to the fabric suddenly, with data acquisition started a few moments before. It is also possible to first connect the test area to the tank, then charge the cylinder up to the test pressure before the data acquisition is started. For the majority of fabrics tested so far, and for relatively low pressure levels, the method of pressure application makes no measurable difference.
Figure 3: Basic construction of the tester
Figure 3  is a typical pressure vs. time graph obtained for a nylon-66 fabric of close woven construction.

Discussion
The graphs as obtained have a stepped nature due to digitising by the data acquisition system. They should be smoothed using a suitable technique that does not affect the gradient. Curve fitting can be applied when the pressure decay is relatively slow, as with fabrics having low porosity. Other techniques can be applied when the pressure decay is faster. Figures 4 and 5 show a p vs. t graph as obtained and the air permeability calculated as volume of free air (i.e. reduced to 100 kPa).

It can be shown that:
Air permeability of the fabric = (V. dp/dt) / (Patm .A ) in appropriate units,

Where,
V = effective tank volume
dp/dt = rate of pressure decay
A = test area
Patm = atmospheric pressure= 0.987 bar


Figure 4: Pressure vs. time graph for a nylon 66 fabric


Figure 5: Calculated fabric air permeability vs. pressure
The principle of permeability measurement applied is valid even for standard fabrics which are relatively open. It was demonstrated that such fabrics can be measured by making use of the low pressure transducer (pressures up to 0.5 kPa). These fabrics require a reduction of the test area to about 5 cm2, in order that the pressure decay is held to a rate that can be followed by the low pressure transducer.

Some others instrument are used to measurement of Air permeability
We bring forth for our valued clients an extensive array of Air Permeability Testers which is made available in analog as well as digital models. Widely used for testing air permeability of the fabrics, the range consists of an arrangement for holding the test specimens between two flat faces so as to expose a known area to the flow of air through it, a vacuum system to draw air through the exposed area of the test specimens.

Design specifications:

  • The system is designed with two arrangements, one for measuring the volume of air flowing through the test specimen, and other to measure the pressure drop between the faces of the test specimen
  • The two round-shaped grips, which hold the test specimens, are lined with rubber gasket to avoid the leakage of air through the edges.
  • The test specimens are held on the grip with the help of a hand operated screw mechanism.
  • The vacuum pump supplied is used to create the vacuum needed to draw the air through the test specimen
  • The digital manometer (or manometer tube) measures the vacuum pressure in terms of mm of water level whereas the airflow is measured by the rotameters attached with the instrument
  • For corrosion resistant finish, the instrument is offered with metallic paint & bright chrome plating
Technical specifications:
  • Is: 11056- 1984: method for determination of air permeability of fabrics
  • Din 53887: testing of fabrics determination & the air permeability of fabrics.
Air Permeability Tester FX3300-IV
The TEXTEST Air Permeability Tester is used for fast, simple, and accurate determination of the air permeability of all kinds of flat materials and of foam cubes. The measuring range covers dense papers and airbag fabrics as well as extremely open non-wovens and forming fabrics.
Air Permeability Tester FX3300-IV
Air Permeability Tester PORTAIR FX3360 
Portable instrument for determination of air permeability profiles in the production and finishing line. Available with a thickness gauge.

Air Permeability Tester PORTAIR FX3360 
Dynamic Air Permeability Tester AIRBAG TESTER FX3350 
The TEXTEST Dynamic Air Permeability Tester FX3350 AIRBAG-TESTER is a new and unique instrument for fast and accurate determination of the average dynamic air permeability of airbag fabrics and of the exponent of the air permeability curve in a selectable test pressure range. These two data describe the air permeability of a fabric in the entire pressure range with a high degree of accuracy. Therefore, they are much more representative for the performance of the fabric in an airbag than the static air permeability, measured with a conventional static air permeability tester.
Dynamic Air Permeability Tester
Determination of air permeability of a fabric

Object of the experiment
Fabric air permeability is a measure to what extent it gives air passing through the fabric. Air permeability, a given area in the vertical direction of the air flow rate, a given time period, is measured by the fabric test area inside the pressure difference of the fabric. Basically, it depends on weight, thickness and porosity of fabric. The porosity of fabric is the demonstration of the air gap as a percentage within fabric. It has been important for especially the tent fabric, parachute fabric, raincoat fabric and garment, the fabric used in air bags, industrial filters and sail cloth. Moreover, when thermal properties of clothing and body interaction are taken into consideration, there has been the effect of air permeability.

Reference Standards
TS 391 EN ISO 9237, ISO 9237, BS EN ISO 9237 

Equipment and materials
Standard atmospheric conditions, air permeability tester, and test samples.

The features of an Air permeability test device:
  • Circular sample holder: The circular sample holder must have a central aperture which can give the opportunity to the experiment in an area of , , or . 
  • Tools for the holders: That should be taken some precautions for preventing the air leakage around the edges of the test pieces. Alternatively, the leak can be measured separately and can be removed from the experimental results. 
  • Protective ring: There should be a protective ring together with the holders to prevent leakage as an optional use. 
  • Pressure indicator or manometer: The experimental part connected to the test head that can measure at least 2% accuracy for showing the pressure drop for 50 Pa, 100 Pa, 200 Pa or 500 Pa during the experimental area. 
  • A device for creating a smooth air stream: The proper air flow to supply a pressure drop 50 Pa and 500 Pa between the test piece on all sides of the test piece holder, the controlled temperature and humidity. 
  • Flowing measurer volumetric counter or measuring range of measures: To determine the air velocity (Venturi) with a minimum accuracy of ± 2% as cubic decimetre per minute.
Sample preparation
Sample preparing process is made in accordance with the process in properties of material that is given for fabrics. In the absence of property, the process below is applied.

The preparation of stack sample (a shipment or a party taken from the track number):
To prepare mass sample, random samples are taken at least as much as the number shown in Schedule from a party. In mass sample, there should not be the moisture-exposed or damaged, the follow-up gives the pieces during transportation

Schedule - Mass Sample
The Number of parts in a party
Minimum number of parts in Stack Samples
≤3
4-10
11-30
31-75
≥76
1
2
3
4
5
 
Mass, from each piece that makes up the sample, a laboratory sample, the single most and at least 1m in length is cut ( It should be provided randomly from one place from the most recent tip of the part at least 3 m distance). It is necessary to ensure that there are no wrinkle regions and a visible mistake in a laboratory sample. Before the experiment, the samples should be conditioned and the experiment should be done in standard atmospheric conditions.

The suggested conditions for the experiment:
  • Experimental surface area = 20 cm2 
  • Pressure drop = 100 Pa for clothing fabrics
  • Pressure drop = 200 Pa for industrial fabrics
When this pressure drop can not be obtained or there are no appropriate cases for this pressure drop, pressure drop for 50 Pa or 500 Pa alternatives can be used and / or for 5 cm2, 50 cm2 or 100 cm2 alternative experimental areas can be selected. To compare results, it is recommended to try the same experimental area with the same pressure drop.

Working Procedure
  1. Preparing appropriate samples in accordance with standard for the air permeability
  2. Conditioning the samples
  3. Setting the pressure and time of the air permeability test device in accordance with the sample.
  4. Placing the sample to the device
  5. Running the device
  6. Reading the value of air permeability of the sample from the indicator of the device at the end of the test.
  7. After taking the arithmetic mean of the test results, to calculate the value of air permeability.
  8. Repeating the test for the appropriate number of samples in accordance with standard.
Test piece is kept to a circular sample holder by being careful not to interfere in the plane of the fabric itself, by applying sufficient voltage if any wrinkles are available. It is necessary to avoid from the wrinkled places and the edges. As the air permeability of the fabric may be different on both side of it, the fabric face subjected to the experiment should be stated in the experiment report.

One side- coated test parts should be stretch toward the edges which have lower pressure to prevent air leakage. For applying air flow towards the test part, air extractor or other vehicles are switched on and as suggested above, an air flow is adjusted until a pressure drop is created in the part of the fabric subjected to experiment. After reaching a minimum of one minute or stabilize the air flow is recorded. Under the same experimental conditions, , the experiment is repeated at least 10 times in different parts of the sample. Finally, taking the arithmetic mean of the test results, the value of air permeability is calculated.

The experiment Result
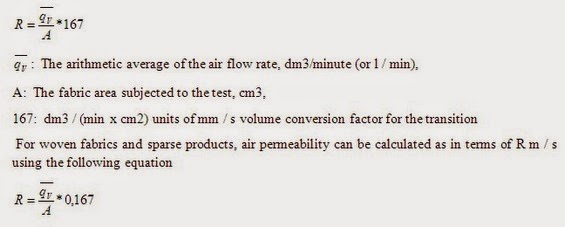
Air permeability (R) is calculated as mm / s by using the following equation.

Measurement and evaluation
Read the following sentences ; then write true “T” or false “F”
  • When taken into consideration thermal properties of clothing and the interaction with body, air permeability is not affected. (… …)
  • The standard used for this experiment is TS 391 EN ISO 9237 (……)
  • It is necessary to ensure that there are no wrinkle regions and a visible mistake in a laboratory sample.
  • Mass, from each piece that makes up the sample, a laboratory sample, the single most and at least 2 m in length is cut (……)
  • Air permeability (R) is demonstrated as mm/s (……)
Porosity
Porosity is the ratio of the volume of openings (voids) to the total volume of material. Porosity represents the storage capacity of the geologic material
Fig.: Pore Size vs. Porosity
Factors influencing porosity in multi-layer woven fabrics
  1. Type of material
  2. Linear density of yarns “warp-weft”
  3. Warp and weft density per cm
  4. Twist factors
  5. Type of spinning
  6. Difference of denting system
  7. Type of stitches
  8. Form and relative porosity
  9. Type of woven construction
  10. Thickness & weight
Porosity and porosity parameters
Flat textile materials, e.g. fabrics, are porous materials which allow the transmission of energy and substances and are therefore interesting materials for different applications. In general, they are used for clothing, interior and wide range of technical applications. Fabric as porous barrier between the human body an environment should support heat and water vapor exchange between the body and environment in order to keep the body temperature within the homeostasis range. Besides thermo-physiological protection, fabrics also play an important role by heat protection due to the flames or convection heat, contact heat, radiant heat as well as due to the sparks and drops of molten metal, hot gases and vapors Fabrics protect users against micro-organisms, pesticides, chemicals, hazardous particles and radiations (radioactive particles, micro-meteorites, X-rays, micro-waves, UV radiation, etc.). They act very important role also by environmental protection as filters for air and water filtrations, sound absorption and isolation materials against noise pollution, adsorption materials for hazardous gas pollution, etc. By all mentioned applications dedicated to absorption, desorption, filtration, drainage, vapors transmission, etc., the essential constructional parameter that influences fabric efficiency to protect human or environment is porosity. The fabric in a dry state is a two-phase media which consists of the fibrous material – solid component and void spaces containing air – gas (void) component. The porosity of a material is one of the physical properties of the material and describes the fraction of void space in the material. The porosity (or void volume fraction) is expressed as coefficient ranging between 0 and 1 or as percentage ranging between 0% and 100% (by multiplying the coefficient by 100). Mathematically, the porosity is defined as the ratio of the total void space volume to the total (or bulk) body volume

Materials and porosity measurements
Our experiments involved woven fabrics made from staple yarns with two restrictions: first, only fabrics made from 100% cotton yarns (made by a combing and carding procedure on a ring spinning machine) were used in this research; second, fabrics were measured in the grey state to eliminate the influence of finishing processes. We believe that it is very hard, perhaps even impossible, to include all woven fabrics types to predict individual macro-porosity parameters precisely enough, and so we focused our research on unfinished staple yarn cotton fabrics. We would like to show that genetic programming can be used to establish the many relations between woven fabric constructional parameters and particular fabric properties, and that the results are more useful for fabric engineering than ideal theoretical models. The cotton fabrics varied according to yarn fineness (14 tex, 25 tex, and 36 tex), weave type (weave value), fabric tightness (55% - 65%, 65% - 75%, 75% - 85%), and denting. The constructional parameters of woven fabric samples are collected in They were woven on a Picanol weaving machine under the same technological conditions. The weave values of plain (0.904), twill (1.188), and satin (1.379) fabrics, as well as fabric tightness, were determined according to Kienbaum’s setting theory

We used an optical method to measure porosity parameters of woven fabrics, since it is the most accurate technique for macro-pores with diameters of more than 10 m. For each fabric specimen, we observed between 50 and 100 macro-pores using a Nikon SMZ-2T computer-aided stereomicroscope with special software. We measured the following macro-porosity parameters: area of macro-pore cross-section, pore density, and equivalent macro-pore diameters.

Woven fabric’s ideal geometric model of porous structure
When a woven fabric is treated as a three dimensional formation, different types of poresare detected 1. inter-pores, e.g. the pores which are situated between warp and weft yarns (macropores, interyarn pores) and pores which are situated between fibres in themyarns (mesopores, interfiber/intrayarn pores), 2. intra-pores, e.g. the pores which are situated in the fibres (micropores, intrafiber pores). The structure and dimensions of the inter- or intrayarn pores are strongly affected by the yarn structure and the density of yarns in the woven structure. As fibrous materials, woven fabrics have, with regard to knitted fabrics or nonwovens, the most exactly determined an ideal geometrical model of a macroporous structure in the form of a tube-like system, where each macropore has a cylindrical shape with a permanent cross-section over all its length.Because the warp density is usually greater than the weft density, the elliptical shape of the pore cross-section is used to represent the situation in Figure . Macropores are opened to the external surface and have the same cross-section area. They are separated by warp or weft yarns, and are uniformly distributed over the woven fabric area. The primary constructional parameters of woven fabrics which alter the porous structure are:
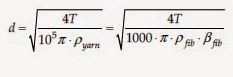
  • Yarn fineness, e.g. the mass of 1000 meter of yarn from which the yarn diameter can be calculated,
  • Type of weave, e.g. the manner how the yarns are interlaced. It has an effect on the pore size as well as on the shape of pore cross-section
  • The number of yarns in length unit (warp and weft densities), which directly alters the pore size. When fibre properties (fibre density, dimension, and shape) are different, two woven fabrics with similar woven structures and geometrical configurations can have distinctly different porosity
Figure:. 2D and 3D presentations of an ideal model of the porous structure of a woven fabric
Where,
(d – yarn thickness, p – yarn spacing, MP - macropore; 1, 2 indicates warp and weft yarns, respectively) To compare woven fabrics with porosity, the following porosity parameters can be calculated on the basis of the woven fabric primary constructional parameters and the ideal model of porous structure in the form of a tube-like system:

The porosity of woven fabrics can be then written in the form of Equation:

Conclusion
This study was carried out to develop a theoretical model to predict air permeability values for fabrics. The theoretical model predicts the value of the air permeability using the pore size and some fabric properties before manufacturing. D’Arcy’s formulation was used to establish an equation expressing the relationship between the air permeability of knitted fabrics and fabric structure parameters. According to the experimental results the fabric with the lowest course count per cm and yarn number in tex has the highest air permeability values. Moreover increasing the loop length produced a looser surface in the fabric and increased air permeability. As the yarn gets thinner and the pores between loops get larger the air permeability will increase accordingly. According to some formulations when the stitch density stitch length or yarn diameter increase pore size values decreases. Due to the differences between ideal and real geometry and the random variation of the fabric structure there are no exact dependence between experimental air permeability and predicted air permeability values. However the closeness of the results of predictions based on calculated values from the theoretical model and experimental values show that our model can be successfully used for the prediction of the air permeability of knitted fabrics. This model is simple and efficient. Permeability and porosity are strongly related to each other. If a fabric has very high porosity it can be assumed that it is permeable. It was also found that there is a near positive linear relationship between pore size and air permeability values hence it could be assumed that the model developed is applicable for predicting the air permeability of plain knitted fabrics produced with different fiber types.