Electromagnetic Radiation:
From sunlight different radiation (radiant energy) of different wave length reach the earth. Some restricts at upper layer, some arrives on earth. Electro-magnetic radiation is a vector & it creates two types of fields which is given below:
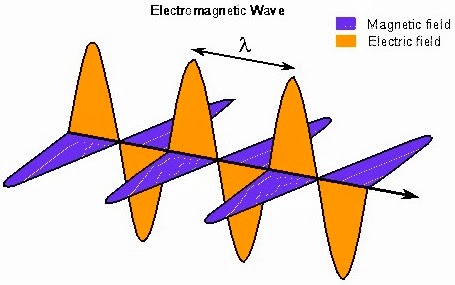 |
| Magnetic wave |
- Electric Field: Vertically propagating waves-
- Magnetic Field: Horizontally propagating waves-
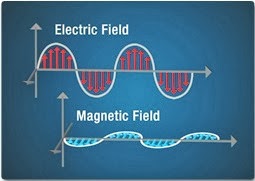 |
| Electric & Magnetic Field |
Visible Spectrum: Within different wavelength radiation from sunlight ,only 300nm-700nm wavelength radiations are light and color sensitive. Light: Light is energy formed by electromagnetic radiation, consisting of elementary particle photon.Light , and all other electromagnetic radiation, travels at a speed of about 299,728 km (185,831 mi) per second in a vacuum. It is made up of electromagnetic waves with wavelengths between 4 × 10⁻⁷ and 7 × 10⁻⁷ meters. Color: Color is a resultant of light, object & viewer specification of wave length of light senses for specific color. Color is developed in human brain after successful perception. A property depending on the relations of light to the eye, by which individual and specific differences in the hues and tints of objects are apprehended in vision; as, gay colors; sad colors, etc.
Primary Colors: These are colors that cannot be created through the mixing of other colors. Primary colors cannot be made from other colors. They are colors in their own right. The primary colors are: 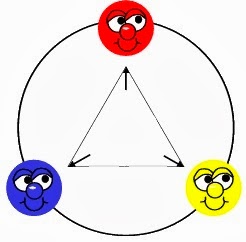 |
| Color wheels show us how colors are related. |
SECONDARY COLOURS: Primary colors can be mixed together to produce SECONDARY COLOURS. Secondary colors are made by mixing two primary colors. Each secondary color is made from the two primary colors closest to it on the color wheel. The secondary colors are: - green
- orange
- violet (purple)
Color and Light Theory: - Additive /Light/RGB Theory
- Substractive /Pigment Theory
1. Additive /Light/RGB Theory: On the basis of different wavelength light combination, additive theory is developed. In this theory primary colors are red, green and blue.
Proportionate mixing of these primaries produces white.
- R+G+B =White
- R+G=Yellow
- G+B=Cyan
- R+B=Magenta
So, Cyan, Yellow, Magenta are Secondary colors. Ex-TV screen, stage lighting etc. 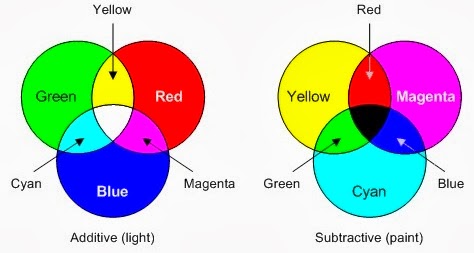 |
| Additive and subtractive color combinitions |
2. Substractive /Pigment Theory: On the basis of absorption of different wavelength of radiation and thus substracting , Substractive theory is developed .Here cyan, yellow, magenta are primary colors.
Proportionate mixing of these primaries produces black color.
White & Black:
White means presence of all wavelength radiation of visual colors .In others words, all colors are reflected.
Black means absence of all wavelength radiation of visual colors. In other words, all colors are absorbed.
- Cyan + Yellow = Green
- Yellow + Magenta = Red
- Cyan + Magenta = Blue
Specification of Color: - Hue: Name of Color; Ex-Red, Green, Blue etc.
- Value: Lightness & Darkness
- Chroma: Brightness & Dullness (saturation & vividness)
Color Space: Color space is a three-dimensional geometric space with axis appropriately Defined so that symbols for all possible color perceptions of humans or other animals fit into it in an order corresponding to the psychological order. In this space each color perception is represented as a point. All colors can be imagined in a range of sphere, cube and triangle to correlate each other. The imaginary range is known as color space. Different color theories for measurement: - Munsell Theory
- CIE Lab Theory
- CIE LCH Theory
- XYZ Theory
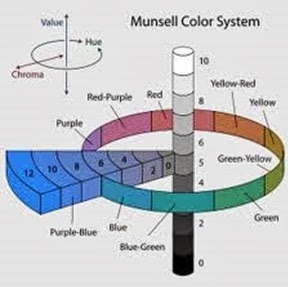
Munsell Color Theory: Color theory is based on the principals made famous by artist Albert Munsell. The 3 aspects considered in his theory are Intensity (light or dark), hue (the actual colors) and Chroma (or saturation).
Munsell modeled his system as an orb around whose equator runs a band of colors. The axis of the orb is a scale of neutral gray values with white as the North Pole and black as the South Pole. Extending horizontally from the axis at each gray value is a gradation of color progressing from neutral gray to full saturation. With these three defining aspects, any of thousands of colors could be fully described. Munsell named these aspects, or qualities, Hue, Value, and Chroma. Every color will be somewhere along this grid.
For example, colors at the bottom of the center pole will be prevalent in the “Deep” seasons. At the top of the pole, those colors will be found in the “Light” seasons.
He selected five principle colors: red, yellow, green, blue, and purple; and five intermediate colors: yellow-red, green-yellow, blue-green, purple-blue, and red-purple; and he arranged these in a wheel measured off in 100 compass points: 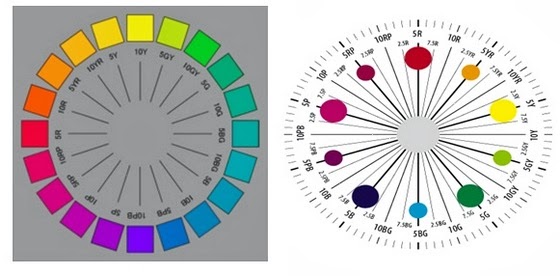 |
| In between two primaries, there are ten subdivisions. |
Value: Value was defined by Munsell defined value as “the quality by which we distinguish a light color from a dark one.” Value is a neutral axis that refers to the grey level of the color.
Represented along the axis of the hue circle vertically and is divided into ten equal steps. 0 refers to black and 10 refer to white.
Chroma:
Chroma is the quality that distinguishes the difference from a pure hue to a gray shade. The chroma axis extends from the value axis at a right angle and the amount of chroma is noted after the value designation. From value axis, perpendicularly towards hue circle chroma scale is developed in 8 divisions as 2, 4, 6, 8, 10 12, 14, 16 Chromaticity: Chromaticity is an objective specification of the quality of a color regardless of its luminance, that is, as determined by its hue and colorfulness (or saturation, chroma, intensity, or excitation purity). Chromaticity is defined as the “property of a color stimulus defined by its chromaticity coordinates, or by its dominant or complementary wavelength and purity taken together.” The apparent color of a light source, specified by its three chromaticity coordinates. Based on the fact that the human eye has three different types of color sensitive cones, the response of the eye is best described in terms of three “tristimulus values”. - From the beginning ,three primaries were considered as three axis of solid
- For simplification purpose, a two dimensional locus was developed.
However, the concept of color can be divided into two parts: brightness and chromaticity. For example, the color white is a bright color, while the color grey is considered to be a less bright version of that same white. Chromaticity Diagram: - The three-dimensional color space CIE XYZ is the basis for all color management systems.
- This color space contains all perceivable colors - the human gamut. Many of them cannot be
- Shown on monitors or printed.
- The two dimensional CIE chromaticity diagram xyY (below) shows a special projection of the
- Three dimensional CIE color space XYZ.
- Some interpretations are possible in xyY, others require the three dimensional space XYZ or
- The related three dimensional space CIE Lab.
The diagram at left represents the mapping of human color perception in terms of two CIE parameters x and y. The spectral colors are distributed around the edge of the “color space” as shown, and that outline includes all of the perceived hues and provides a framework for investigating color. Color Gamut: The gamut of any RGB system is mostly visualized by a triangle in xyY. Color gamut is specified color region derived from CIE chromaticity diagram. The chromaticity diagram below shows the actual gamut for different luminances Y. Low luminances seem to produce a large gamut. The gamut appears similarly in all RGB systems. A color outside the triangle (which is defined by the primaries) is always out-of-gamut. A color inside the triangle is not necessarily in-gamut. The diagram represents all of the chromaticity’s visible to the average person. These are shown in color and this region is called the gamut of human vision. Object: - To know hue, brightness and lightness.
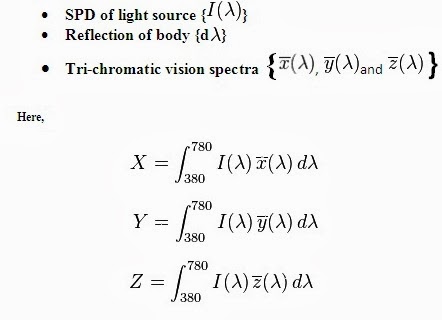
Complementary Color: Two colors by addition producing white are known complementary color to each other. Spectral Power Distribution: A pictorial representation of the radiant power emitted by a light source at each wavelength or band of wavelengths in the visible region of the electromagnetic spectrum (360 to 770 nanometers). The SPD can be measured by a spectrophotometer. From the SPD both the luminance and the chromaticity of a color may be derived to precisely describe the color in the CIE system. Spectral Power Distribution (SPD) curves chart the spectral characteristics of a light source, showing the radiant power of the light source at each wavelength or band of wavelengths across the visible spectrum. The SPD of light from an illuminated surface is the product of the percent reflectance of the surface and the SPD of the light which falls on the surface. An example of the spectral power distribution of light from common objects shows that such colors arise from a range of wavelengths. Even the vivid red of a tomato involves a range of wavelengths in the red region of the visible spectrum. Color Stimulus: A radiant flux capable of producing a color perception.Colour is carried by light, electromagnetic waves, but the sensation of colour is subject to many other influences, which makes its quantitative description difficult, to say the least.
For colour measurement, therefore, one uses “free colours” (or aperture colours), a structureless viewing field, and the only question is whether the two halves of the field are equal or not. This eliminates all additional clues we might get on the “true” colour of the object. It is determined by: 